The Important Role of Thermal Imaging for Condition Monitoring
Manufacturing and production processes consistently face challenges in ensuring the longevity and efficient functioning of their equipment, especially as they age. Just like any entity subjected to time, equipment equipment breaks down due to friction, corrosion, thermal and mechanical cycling, vibration, and other forces. The inevitable progression of these factors results in reduced performance, and ultimately, equipment failure. The crux, then, is to determine when this will occur so preventive maintenance can be performed at an optimal time to prevent failure at lowest possible cost, without significantly impacting production.
Identifying Failures Before They Happen: The P-F Curve
Those entrenched in condition monitoring are no strangers to the P-F curve, developed by Nowlan and Heap. It illustrates the different stages of a component's lifecycle, illustrating when an inspection method might shed light on equipment's health, right from the proactive stage to when a fault is discerned.

As you can see, temperature analysis is one condition monitoring technique used in the predictive domain. Enter: Thermography. As an essential condition monitoring technique, thermography serves as an early-warning system, indicating when machinery or assets are showing signs of wear, even before a discernible fault emerges.
Measuring Temperature
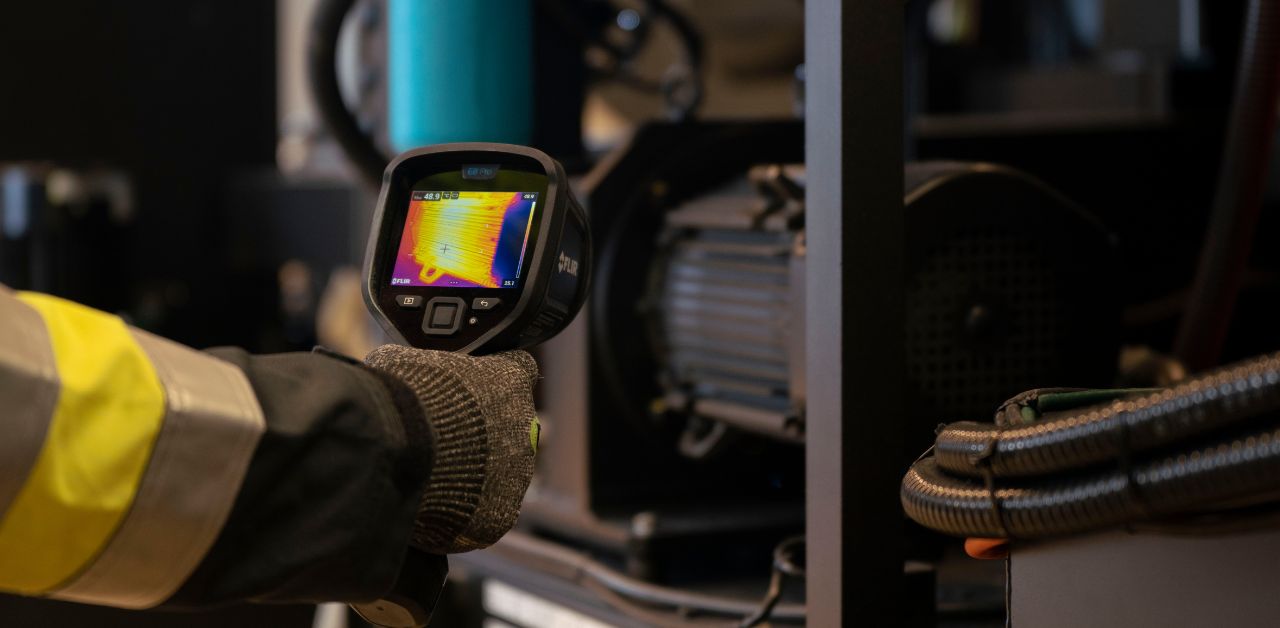
At its core, thermography involves capturing temperature readings of an asset. A singular temperature reading can offer insights, yet its standalone value might be somewhat limited. Consider an electrical motor in a factory running at 73°C (163°F). Without additional data, is this concerning? To ascertain this, one might need to delve into the specifics of the motor, examining its standard operating temperature range. Yet even that might not offer a complete picture.
For instance, if the standard range of the motor is from 50°C (122°F) to 80°C (176°F), at 73°C (163°F) the motor currently runs at the higher end of this range. However, how frequently should it be inspected? What's the current condition? When is maintenance required? Will it fail? These questions remain unanswered, and we have no ability to predict the future condition of this motor.
The Importance of Trend Analysis
Understanding a machine's health goes beyond a single measurement. External and internal factors, such as load variations, cooling efficiency, and environmental conditions, can influence the operating temperature. Tracking these temperatures over time provides condition monitoring specialists with a clearer picture.
Let's use data visualization to illustrate this. If we monitor the temperatures of an electric motor installed in January 2019 every month, patterns start emerging. Perhaps the temperature fluctuates between 50°C and 55°C, correlating with the changing seasons. This suggests that the motor operates within a safe range and is not overloaded. Regular checks every two or three months might suffice.
However, another motor from the same time may show a consistent rise in temperature, indicating potential issues. Various factors, like the environment or internal parts, can influence these changes. Such trends highlight the need for regular maintenance and cleaning.
What is missing is a trend, baseline, or pattern of the normal operating conditions of this motor. With such a broad range of standard operating temperatures it is difficult to know the condition of the motor with a single measurement. Building a trend of operating temperatures will allow a condition monitoring specialist to accurately assess the condition of the motor.
If an electric motor was installed in January 2019, and monthly temperature readings were taken, then these temperatures could be plotted to identify what the operational norms are for this specific motor, in this location, powering this specific process. A well-functioning motor may record temperatures similar to the graph shown below.

Temperature Trends of Electric Motor 1 (Years 2019-2023): Seasonal variability in electric motor indicating stable performance within standard operating ranges
This graph shows an electric motor that has a degree of temperature fluctuations between 50°C and 55°C (122°F and 131°F) which track reasonably well with the seasons of the year, getting warmer in the summer and cooler in the winter. So, what can we ascertain from this information? The motor is operating at the lower end of the standard operating temperature range and does not appear to be mechanically overloaded or under an especially high load. A condition monitoring professional may even decide to inspect this motor every two or three months unless temperatures change significantly. This motor shows no obvious signs of concern, and we would expect it to continue working reliably for the foreseeable future.
Another motor was also installed next to this one in 2019, and its temperature readings have also been captured on a monthly basis, below you can see how that motors temperature compares.

Temperature Trends of Electric Motor 2 (Years 2019-2023): Seasonal Variations, Rising Patterns, and the Impact of Maintenance Interventions
The above graph illustrates the temperature trends of Electric Motor 2 over several years, highlighting a few key observations:
Seasonal Similarities and Rising Temperatures: Initially, the temperature patterns mimic seasonal changes similar to the early years. However, a noticeable increase is observed by 2021, diverging from earlier trends and indicating a potential issue.
Temporary Decline in Temperatures: A significant drop in temperatures during August and September 2022 suggests a corrective action or change in conditions, leading to a return to acceptable operating temperatures.
Operational Norms and Reliability Predictions: Despite these fluctuations, the temperatures remain within the motor's operational norms. Understanding this motor's history aids in predicting its future reliability.
Environmental Influences: Such temperature trends are common in environments where dust and debris gradually block cooling fins and airflow, leading to a steady temperature rise. A subsequent cleaning can restore cooling efficiency.
Alternative Causes: It's important to note that this trend could also stem from various factors such as motor loading, larger debris, changes in drive chains or belts, cooling fan placement, or hot air extraction.
Importance of Monitoring and Maintenance: This graph serves as a reminder of the importance of regular cleaning and maintenance. It highlights the need to be aware of different factors that can influence motor temperature and emphasizes the significance of addressing basic cooling issues to prevent more serious problems in the future.
In summary, while this thermal graph points out anomalies and suggests possible issues, it cannot definitively pinpoint the cause. Regular monitoring and maintenance, along with a keen understanding of the motor's operating environment and history, are crucial for ensuring its optimal performance and longevity.
Now, let’s investigate a third electric motor that was also installed in 2019 and see how that compares.

Temperature Trends of Electric Motor 3 (Years 2019-2023): Rising above seasonal norms within manufacturer's specifications, indicating potential need for investigation
The graph above illustrates the temperature trend of Electric Motor 3, offering valuable insights:
Initial Temperature Readings: The motor shows a temperature of 73°C (163°F), which falls comfortably within the manufacturer's specified operating norms. This indicates that, initially, the motor was functioning as expected.
Significance of a Single Temperature Reading: While a one-off reading of 73°C (163°F) is not alarming and could even be seen as reassuring, it is the overall trend that demands attention. A single data point does not always provide a complete picture of the motor's health.
Comparison with Other Motors: Motor 3's performance, up until a certain point, was consistent with the yearly seasonal variations observed in Motor 1 and Motor 2. This suggests a pattern of behaviour typical for these types of motors under normal conditions.
Recent Temperature Increase: However, the graph shows a change starting from January 2023. The motor's temperature began to rise, deviating from the usual pattern. This change could signify an underlying issue affecting the motor's performance.
Need for Further Investigation: The recent increase in temperature, especially when compared to historical data, suggests that there may be a developing issue with Motor 3. This warrants further investigation to identify the cause and to determine whether any maintenance or adjustments are needed to prevent potential failures.
What could the future look like for the third electric motor? Here are two potential scenarios shown by the two graphs below.

Temperature Trends of Electric Motor 3: Risk of overheating without maintenance leading to failure beyond 105°C

Temperature Trends of Electric Motor 3: Managed temperature increase within safe limits
If this motor was left in use with no investigation, maintenance or further action then the temperature could continue to rise until the point of failure. This is shown by the top graph on and provides an insight that temperatures exceeding 105°C (221°F) cause immediate failure.
The second graph tells a different story, perhaps the demand placed on the motor was purposely increased by the production process that the motor operates being sped-up to meet a new output requirement? The temperatures are still within the motors acceptable operational range and there is a clear explanation as to the root cause of this thermal anomaly.
Conclusion: Optimizing Equipment Health Monitoring with Thermal Trend Analysis
Individual temperature readings provide an insight into the condition of equipment which can only be compared to the manufacturer’s recommended operational range for a motor, or other asset in a manufacturing or production process. This can be misleading and will fail to provide real insights into the condition of assets and equipment which may be vital to the reliable operation of a business.
Taking regular temperature readings builds a picture of the condition of every asset inspected. This does not mean that temperatures will never change, but there will often be reasons for thermal anomalies. If there is an unexplained temperature change then it may be possible to inspect, clean, maintain or take other action to restore the equipment to its normal operating temperature – or it may simply now run hotter and require further monitoring to predict the point of failure more accurately.
If your business relies on manufacturing or production equipment, electrical panes, motors, pumps, machinery or other mechanical or electrical equipment to survive then it is probably important to you that this equipment doesn’t fail unexpectedly. FLIR condition monitoring solutions are commonly used in manufacturing or production environments to take temperature readings accurately.
Visit FLIR.com to learn more about how FLIR solutions could protect your business, and when you’re ready, one of our Technical Product Specialists can visit to demonstrate how easily thermal condition monitoring could support your business.
Related Articles
-
 Fundamentals
Why Measure Temperature?
Read the Story -
 Recorded Webinar
Thermal Process Monitoring for Thermoforming
Watch now -
 Fundamentals
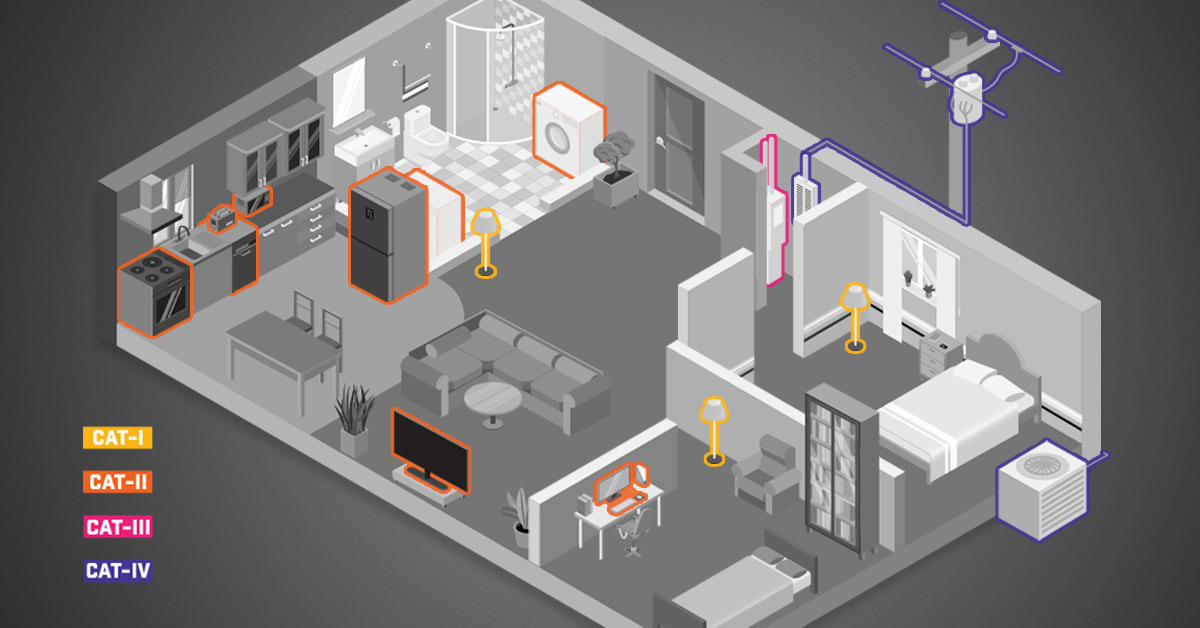
What do CAT Ratings Mean?
Learn more