Using Optical Gas Imaging to Comply with OOOOa Regulations: A Case Study
Natural gas compressor stations have to comply with new EPA regulations on inspection, known as Quad OA. Optical gas imaging provides an efficient, cost-effective means to meet the requirements.
In June 2017, new regulations from the Environmental Protection Agency about the
monitoring of natural gas compressor stations went into effect. The rules require quarterly checks for methane leaks at any compressor station that has been newly constructed or modified since September 2015. While the EPA’s main concern is reducing emissions of methane, a potent greenhouse gas, experience is starting to demonstrate that regular testing using infrared (IR) cameras can save companies money and improve worker safety as well.
The new rule is “Oil and Natural Gas Sector: Emission Standards for New, Reconstructed, and Modified Sources,” which EPA labels as Subpart OOOOa to 40 CFR Part 60, and which is widely referred to as Quad OA. Under the regulation, compressor stations have options for how to perform the required monitoring.
One option is Method 21, an older technology that uses a “sniffer” to detect the presence of hydrocarbon gases and report it in parts per million. The more modern option, and the one designated by the EPA as the “best system of emission reduction,” is optical gas imaging, which uses an IR camera to see plumes of gas
leaking from pipes and equipment. Optical gas imaging uses spectral filtering to target the infrared wavelengths absorbed by the gas, letting the user visualize otherwise invisible gas.
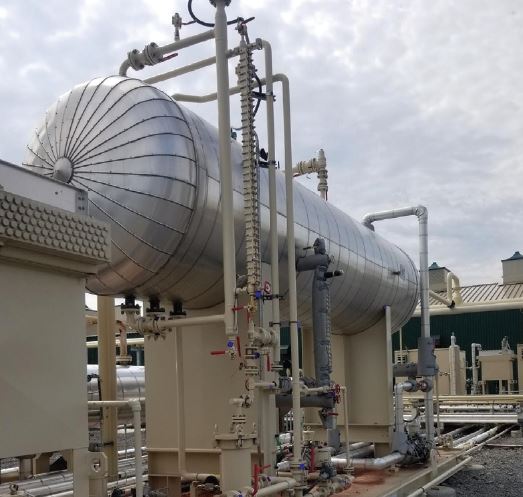
A natural gas compressor station has many seams and joints that can be sources of gas leaks
A Better Technique
Optical gas imaging has some advantages over Method 21. Most importantly, it allows inspectors to actually see where the gas is coming from, to localize the leak to, say, a valve or a pipe joint, making it easier to find and repair. Method 21 only reports the concentration of methane in the air at the spot where the test is performed, but cannot provide any information about the rate or direction in which the gas is flowing, making it challenging to find the source of the leak.
The other advantage of optical gas imaging is that, because it’s a visual method, it allows the inspector to survey a whole scene from a particular vantage point. Method 21 requires physical contact with every potential leak source, every pipe seam and joint and valve. Some of those aren’t easily accessible, and touching every piece of equipment is time consuming. If the inspector is doing a thorough job, he can perhaps check 500 components in a day. If a compressor plant has, say, 6,000 components, it would take a single technician 12 days to test them all. An optical gas imaging camera, stopping at various spots in the plant to survey a wide area, could complete the job in less than a day.
The camera does not provide a quantitative measurement of the leak, although the size of a gas plume provides some idea of the volume of gas. An experienced camera operator can provide a qualitative evaluation of the leak size (small, medium, large, very large) or even an estimated leak rate, providing an additional layer of information to prioritize leak repairs. But if a station operator wants to put a number on it, they can use the sniffer at the source of the leak identified by the camera, getting a parts per million reading without having spent as much time searching for leaks. Once repairs have been carried out, plant operators can confirm
them with another camera inspection, or perform a bubble test, placing a surfactant on the leaky area to see if there’s any escaping gas that causes the solution to bubble.
A Case Study
To measure the effect of implementing these new regulations, Target Emission Services, a contractor that performs inspections for leak detection and repair at compressor plants, collected data from several inspections. Based on what it found, optical gas imaging surveys not only allowed companies to comply with EPA rules, they also showedeconomic benefits for the companies. During the four quarters of 2017 and the first quarter of 2018, Target performed a total of 224 inspections at 104 facilities in nine different states owned by five compressor companies. There were an average of 2.4 compressors per facility. Each monitoring event was carried out by a technician with at least 1,000 hours of experience in optical gas imaging. They used a FLIR GF320 camera with a spectrally filtered indium antimonide detector and resolution of 320 by 240 pixels. The camera was used in high-sensitivity mode for enhanced leak detection.
Leaks From Small To Large
The severity of a leak is characterized by the gas flow rate. Gas flow is not
measured by the camera, but by a Hi-flow Sampler. A rate of less than 0.1 cubic
feet per minute (cfm) is considered low severity, from 0.1 to 0.5 cfm is medium,
and greater than 0.5 cfm is high severity. Inspectors discovered a total of 1,977
leaks. Of those, 65 percent, or 1,291 leaks, were low severity. Another 32 percent, or 630, were medium severity. And 3 percent, or 56 leaks, were high severity leaks. The smallest leak discovered measured only 0.01 cfm, while the largest was 7.85 cfm.
Every cfm of escaped gas represents a cost of roughly $1,600 per year, so that 7.85 cfm means a loss of more than $12,500 worth of gas in a year.
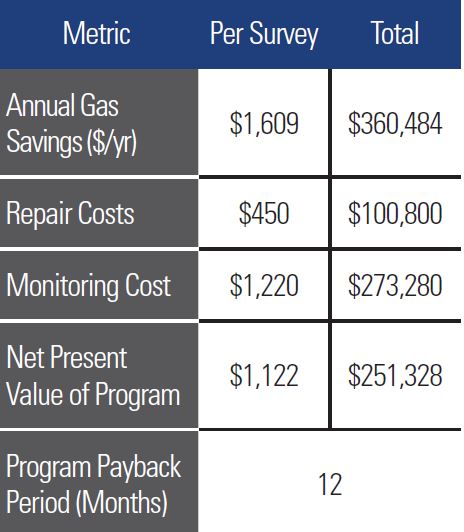
Table 1. The average and total leaks monitored during five quarters of 2017 and 2018.
Source: Target Emission Services.
While numbers like that suggest that the greatest return comes from finding and
repairing the largest leaks, it’s important to note that by volume, the large number
of small leaks roughly equaled the lesser number of large leaks, each accounting for
about 27 percent of the gas lost, while the medium leaks made up the other 45 percent.
The inspections turned up an average of 19 leaks per facility, nine leaks per survey. The average total leak rate per facility was 2.4 cfm.
Notable Savings
The economic benefits were clear. The average monitoring cost per survey was
$1,220, and repair costs were $450. That leads to an annual saving of gas worth
$1,609 per year, and the average lifetime of a repair is two years. Applyingnet present value with a 10 percent discount — a method of comparing the present value of money spent to the value it would have in the future if it were invested — to the value of the gas saved yields a benefit of $1,122 per survey. (See Table 1.)
Over all the facilities, a total of more than $360,000 worth of gas was saved
annually, for a net present value of more than $251,000. Companies would have to
comply with the regulatory requirements whether they realized a savings or not,
so that quarter-million dollars might be considered a bonus.
Higher Safety, Lower Emissions
Monetary returns are not the only benefit of monitoring. Another is improved safety. Of all the leaks found, 22 were identified as potential safety hazards. Seven of those were high hazards, and three were considered extreme. Leaks are considered dangerous when they lead to high concentrations of gas that start to approach the lower explosive limit, the concentration at which the gas can
combust. High concentrations can pose a risk of fires or explosions hazard, so discovering such leaks before they cause such a problem is extremely valuable.
The leaks can also pose a hazard to personnel. Approximately 60 percent of those
leaks were found in areas where facility operators or maintenance staff were working. The facilities were unaware of those leaks, despite having gas detection equipment in their buildings.
Finally, there’s the emissions benefit. The EPA wants to discover leaks in order to reduce the amount of methane released into the atmosphere. The total amount of methane discovered during these inspections was theequivalent of 59,000 metric tonnes of carbon dioxide per year.
Improvement Over Time
As might be expected with a new program, the earliest inspections generally found
the most leaks, with fewer turning up in subsequent surveys. The average change
in the leak count between surveys was a drop of 18 percent, with an average drop of 23 percent for the leak rate. That could vary widely among facilities, however. The largest count increase between surveyswas 1,066 percent, and the largest rate increase was 3,800 percent. At the other extreme, the largest count decrease was 90 percent and the largest rate decrease was 96.9 percent. Only 5 percent of the leaks recurred. (See Figure 1.)
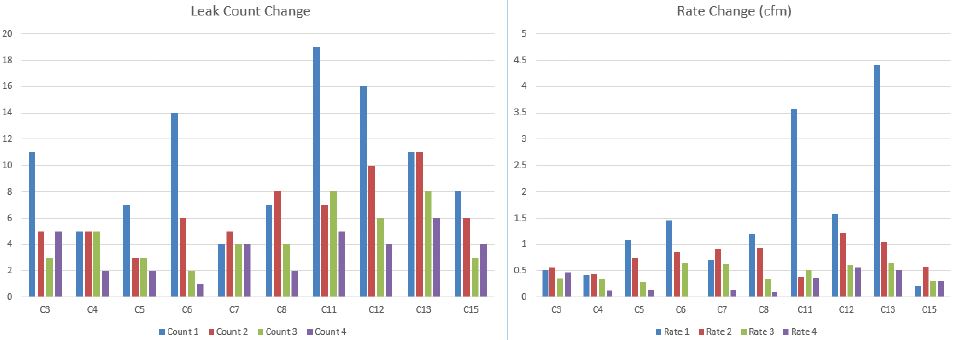
Figure 1. Both the number and the rate of leaks generally decreased from the first inspection to the fourth at the compression facilities inspected. Source: Target Emission Services.
Much of the increase can be attributed to the fact that some facilities were not operating at the time of the inspection, often because demand for natural gas
was lower due to the time of year. A subsequent survey where the equipment
was running and pressurized would naturally have a higher rate of leaks to be
found. A number of new leaks could also appear after the equipment had been taken apart and reassembled. Without those changes in operational status, the surveys generally found a decrease in leaks from one inspection to the next. By the time of the fourth quarterly inspection — for those facilities that had been surveyed four times— the leak rate had dropped to a “steady state” or maintenance level.
One important aspect of leak inspectionis reporting and tracking of results and
responses. Target found that the vast majority of leaks it discovered were repaired within the 30 days required by the regulations. Afull 10 percent were repaired immediately upon discovery; that often entailed simply tightening a connection. Another 9 percent were repaired within five days, 21 percent within 15 days, and 54 percent in 16 to 30days. Some particularly tricky problems that cannot be fixed within a month can be listed as “delay of repair” (DOR), and 3 percent of the leaks were given that designation. Only 3 percent were overdue, neither completed nor
listed as DOR.
Clear Benefits
Overall, Target’s case study found significant economic benefits to companies from using optical gas imaging for finding and repairing leaks, thus eliminating a waste of their gas. The auxiliary benefits included increased safety for the plant and the workers and a reduction in greenhouse gas emissions. Target found that facility operators were responsive to needed repairs and that the number of leaks that recurred was negligible. Quarterly inspections increase the probability of finding each compressor in full operating mode, when the highest number of leaks
would be expected. In short, optical gas imaging not only lets compressor companies meet regulatory requirements, it also saves them money and makes their facilities safer.
Related Articles
-
 Case Study
Remote detection and localization of gas leaks with autonomous mobile inspection robots in technical facilities
Read the Story -
 Case Study
Tracing gas leaks: maintenance and safety problems highlighted
Read the Story -
 Application Story
Advances in Optical Gas Imaging (OGI) technology make leak detection safer at pipelines, tanks, and industrial plants
Read the story